Hotel Revenue Analysis
An analysis of hotel revenue trends and performance metrics across different hotel types and time periods. The project includes data preparation in MySQL, exploratory data analysis, and an interactive dashboard created in Power BI to visualize key insights and recommendations for the hotel business.
Overview
Project description
This is an exploratory data analysis and data visualization project on a hotel dataset with aims to assess revenue performance and discover trends. EDA was carried out in MySQL by developing queries, and then the findings were visualized in Power BI by connecting the database. I focused mainly on the following questions:
- Is hotel revenue growing by year? How does it differ by hotel type?
- Should the company increase its parking lot size? Is there any trends in guests with personal cars?
- What other trends can be seen in the data? Is there seasonality?
Executive summary
Key findings include:
➡️ There is a drastic drop in revenue in 2020, possibly due to COVID-19 pandemic. Further analysis is advised to see if this is really the case.
➡️ Current parking lot size is sufficient and there is no need for improvements.
➡️ Revenue spikes in the summer for resort hotels and in holiday season for city hotels. This trend can be capitalized on with additional tailored marketing campaigns.
➡️ Overall ADR has seen a steady increase. More granular data required (including KPIs such as occupancy rate and revenue per room) to check if it reflects real business growth.
Comprehensive insights and recommendations section can be found at the end of this page.
Table of contents
- About dataset
- Data preparation
- Exploratory data analysis
- Dashboard
- Insights & recommendations
1. About dataset
Dataset is sourced from AbsentData and contains information on hotel bookings of an accommodation company. It consists of three CSV files for three years: 2018, 2019, and 2020. The dataset has several relevant columns for this project: the average daily rate of bookings, hotel types (city hotel versus resort hotel), weekday and weekend stays, arrival date, and parking spaces.
2. Data preparation
I started by creating a database in MySQL and importing the CSV files. Since the dataset consisted of multiple files, I used the following query to create a CTE and combine them:
USE `hotel_db`;

WITH revenues AS (
SELECT * FROM hotel_db.rev_2018
UNION
SELECT * FROM hotel_db.rev_2019
UNION
SELECT * FROM hotel_db.rev_2020
)
3. Exploratory data analysis
There was no separate column displaying revenue in the dataset, so I had to calculate an estimate by taking the sum of weekday and weekend stays, then multiplying it by average daily rate.
SELECT
    arrival_date_year AS arrival_date,
	ROUND(SUM((stays_in_week_nights + stays_in_weekend_nights) * adr)) AS revenue
FROM revenues
GROUP BY arrival_date_year;
I did a similar calculation to get the revenues by hotel type: city hotels and resort hotels, which would later be useful for comparing their performance.
SELECT
    arrival_date_year AS arrival_date,
    hotel AS hotel_type,
    ROUND(SUM((stays_in_week_nights + stays_in_weekend_nights) * adr)) AS revenue
FROM revenues
GROUP BY arrival_date_year, hotel
ORDER BY hotel_type, revenue DESC;
Lastly, I created another column showing the car parking percentage of customers.
SELECT
	arrival_date_year,
    hotel,
    SUM((stays_in_week_nights + stays_in_weekend _nights) * adr) AS revenue,
	CONCAT(
        ROUND((SUM(required_car_parking_spaces) / SUM(stays_in_week_nights + stays_in_weekend_nights)) * 100, 2), '%')
        AS parking_percentage
FROM revenues
GROUP BY arrival_date_year, hotel;
4. Dashboard
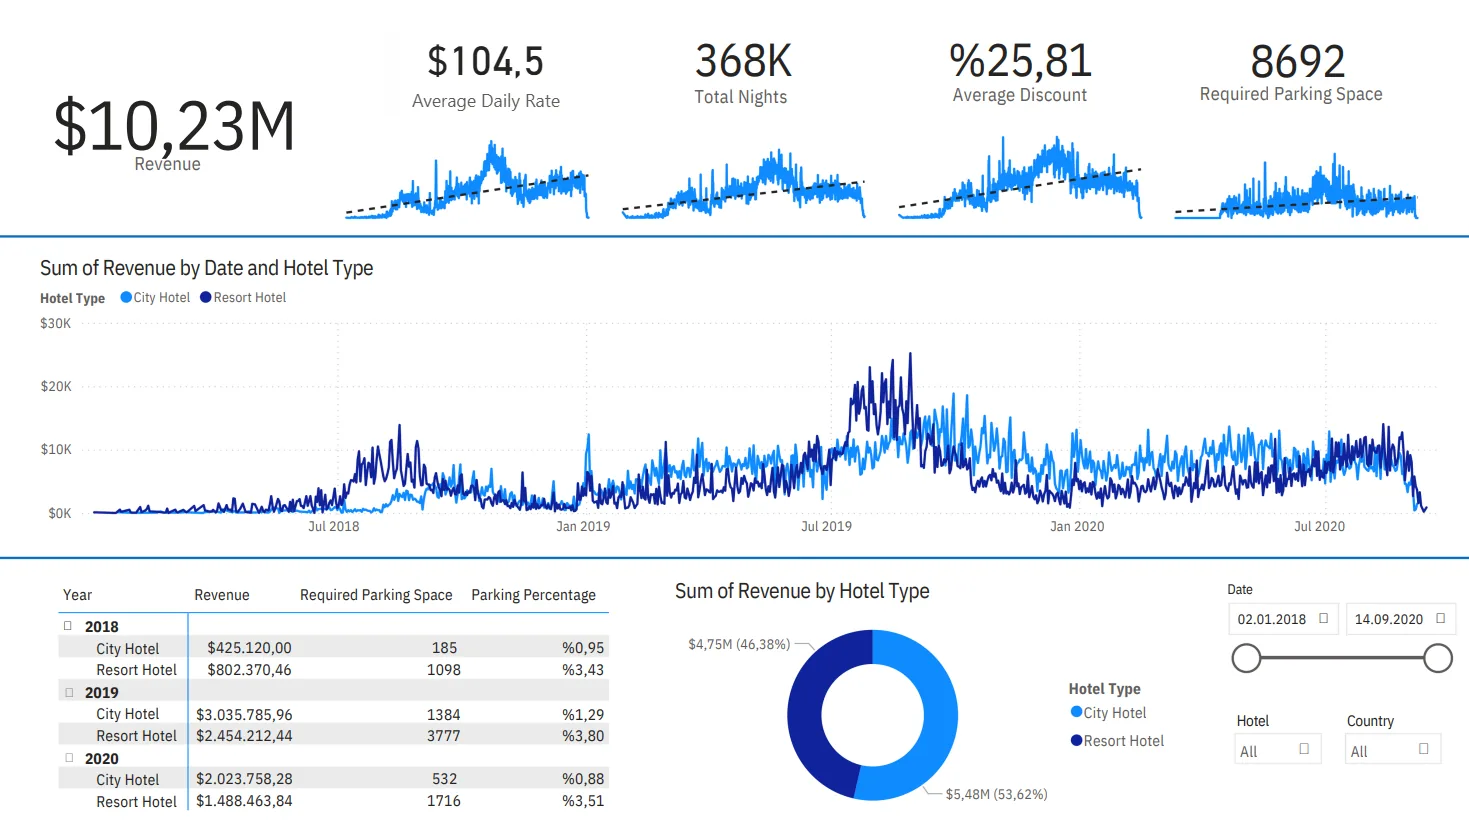
I created an interactive dashboard utilizing the previous queries to visualize key performance metrics such as total revenue, ADR, total hotel stays, required parking spaces. I added charts with trendlines, date sliders, and a revenue table as a quick and easy way to get a sense of various KPIs.
5. Insights & recommendations
📌 Hotel revenue peaked in 2019 for both hotel types.
2018 has the lowest revenue. The dataset is not complete for 2020 (doesn’t contain the last quarter), but when compared only by the first three quarters, 2020 falls short of 2019. 2019 has $3.91M in revenue for the first three quarters while 2020 has $3.51M. There is a drop in overall hotel stays in parallel. The drop is most pronounced in the summer months, and might be an impact of the COVID-19 pandemic. By mid-2020 COVID-19 was already widespread and global lockdowns were in place, which can account for the performance drop in 2020 summer season.
Recommendation: 2020 revenue dip should be more closely examined to understand if it really is an effect of the pandemic, or whether any other factor has influence on it.
📌 Required parking space consists of only a small percentage.
The dataset shows that there is a slight increase in overall required parking space, but it actually forms a very small percentage. Neither hotel type exhibits a drastic demand for parking space.
Recommendation: Consider canceling planned parking lot expansion.
📌 Seasonality and holiday season effects can be seen for both hotel types.
Hotel stays and overall revenue increase by large during the summer months for resort hotels. There is another spike in the holiday season, with city hotels seeing a larger demand than resorts.
Recommendation: Tailored marketing campaigns can be conducted for resort hotels during summers, and for city hotels during holiday seasons to maximize revenue in these peak periods.
📌 There is a steady increase in average daily rate.
Average daily rate, which is a significant indicator of pricing power in the hotel industry, can be influenced by other factors and its rise might not be a result of genuine improvement in the business. Increasing ADR is a positive indicator as long as occupancy rate and revenue per room are also stable and/or increasing. For example, it is possible that ADR has increased while occupancy rate fallen, which would have decreased the revenue per room.
Recommendation: Conduct further analysis by incorporating additional KPIs and using more granular data to gain insight into the increase in average daily rate.