Cookie Cats A/B Test Analysis
An A/B test analysis of the Cookie Cats mobile game, evaluating the impact of moving a gate from level 30 to level 40 on player retention and engagement. The analysis includes statistical testing, business impact estimation, and recommendations based on the results.
Executive Summary
Business question: Does moving the gate from level 30 → 40 affect player retention and engagement?
Primary metric: Day‑7 retention (retention_7).
Guardrail metrics: Day-1 retention (retention_1) and engagement (sum_gamerounds).
Result: Moving gate to level 40 reduces day-7 retention by ~0.8 pp (p < 0.05) with 95% CI [-1.33, -0.31] pp, which is negative and below the pre‑specified 1.0 pp MDE. Tests on guardrails indicate an insignificant difference.
Decision: Do not roll out. While the result is statistically significant, the effect is negative and below the practical threshold.
Dataset
| column | data type | description |
|---|---|---|
userid | int | Unique player ID |
version | str | Experiment split (gate_30 = control, gate_40 = treatment) |
sum_gamerounds | int | Total rounds per player |
retention_1 | bool | Active 1 day after installing the game |
retention_7 | bool | Active 7 days after installing the game |
Contains approximately 90k players (each row corresponding to 1 player), balanced across experiment groups.
Experiment Design
Population: gate_30 and gate_40 players, with a split of approximately 45k records (checked by SRM test).
Primary metric:
- Day-7 retention (
retention_7): Two‑proportion z‑test
Retention at day 7 is considered as a significant indicator of LTV in the industry.
Guardrail metrics:
- Day-1 retention (
retention_1): Two-proportion z‑test - Engagement (
sum_gamerounds): Mann–Whitney U test and Welch's t-test on log-transformed data
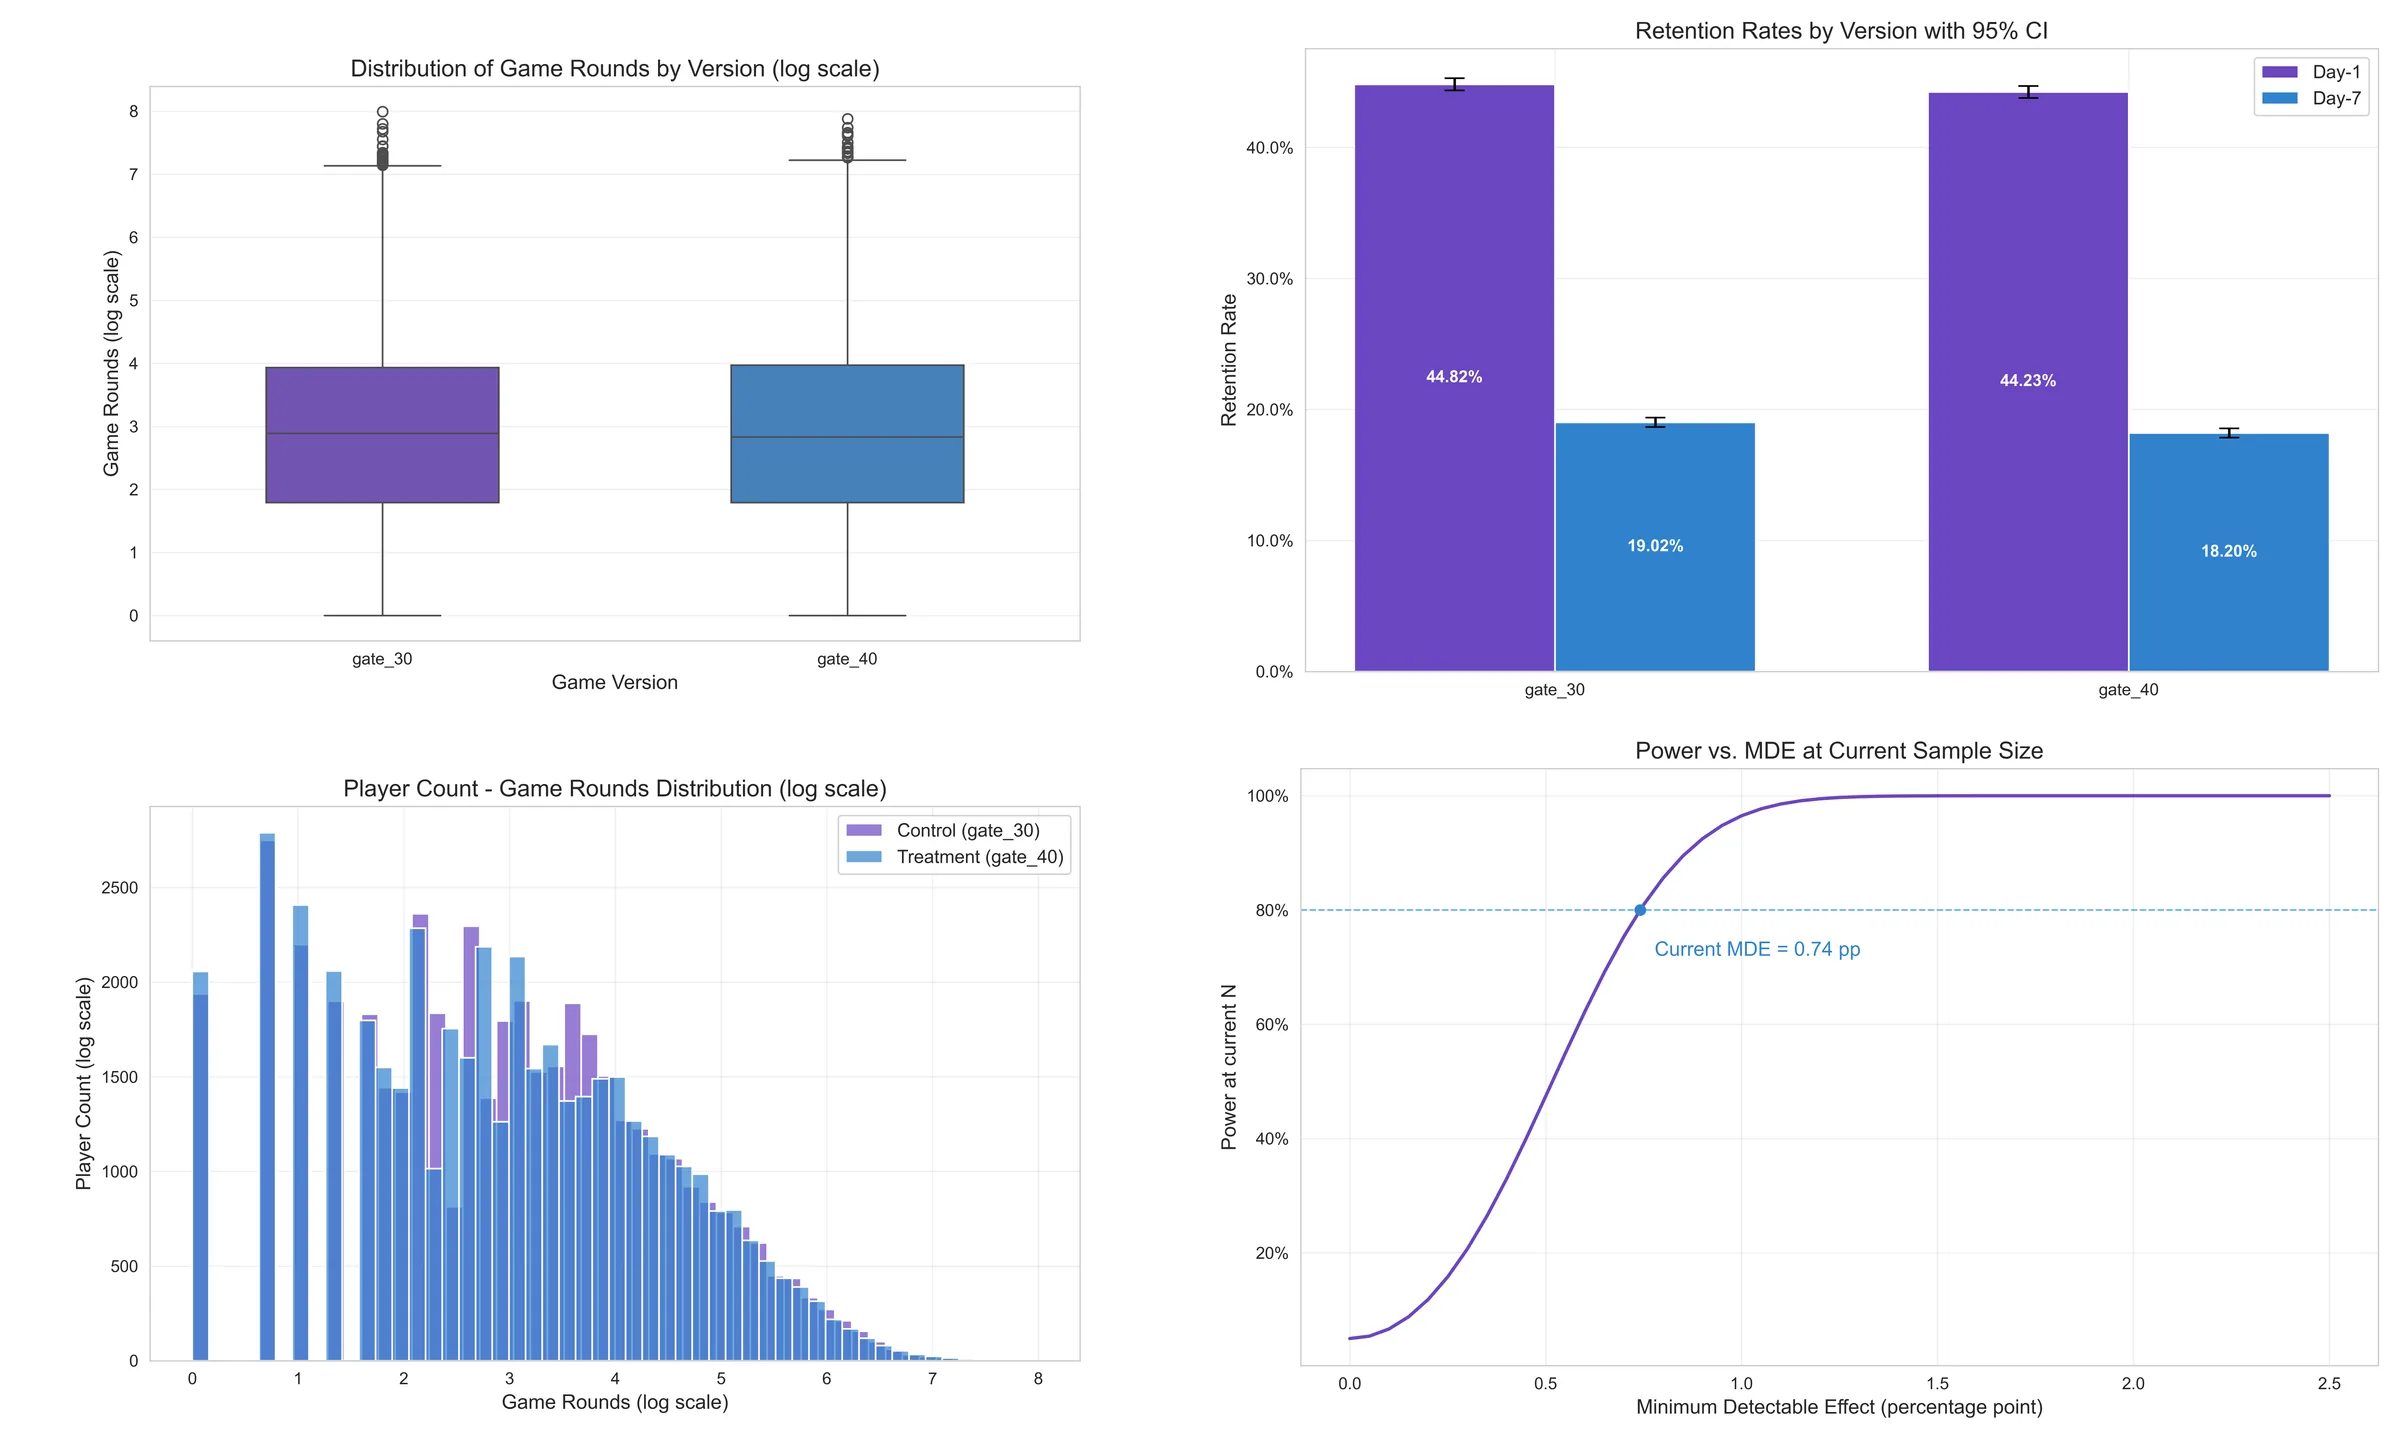
Power / MDE: 80% power target, 1.0 pp MDE. Observed sample size achieves 0.74 pp MDE, a smaller detectable effect than the designed 1.0 pp MDE at 80% power.
Significance level: Pre-specified as 5% (alpha = 0.05) with 95% CI
Multiple testing correction: Guardrails adjusted via Holm method
Decision rule: Rollout only if the result is statistically significant, the experiment effect is larger than 1.0 pp, and guardrails do not display any negative effect.
Sample Ratio Mismatch check: Chi-square test (alpha = 0.001) on assignment counts
Results
Chi-square p = 0.008 passes SRM check but it is in a cautionary range.
| Metric | Test | Control | Treatment | Abs Δ (pp/unit) | p-value |
|---|---|---|---|---|---|
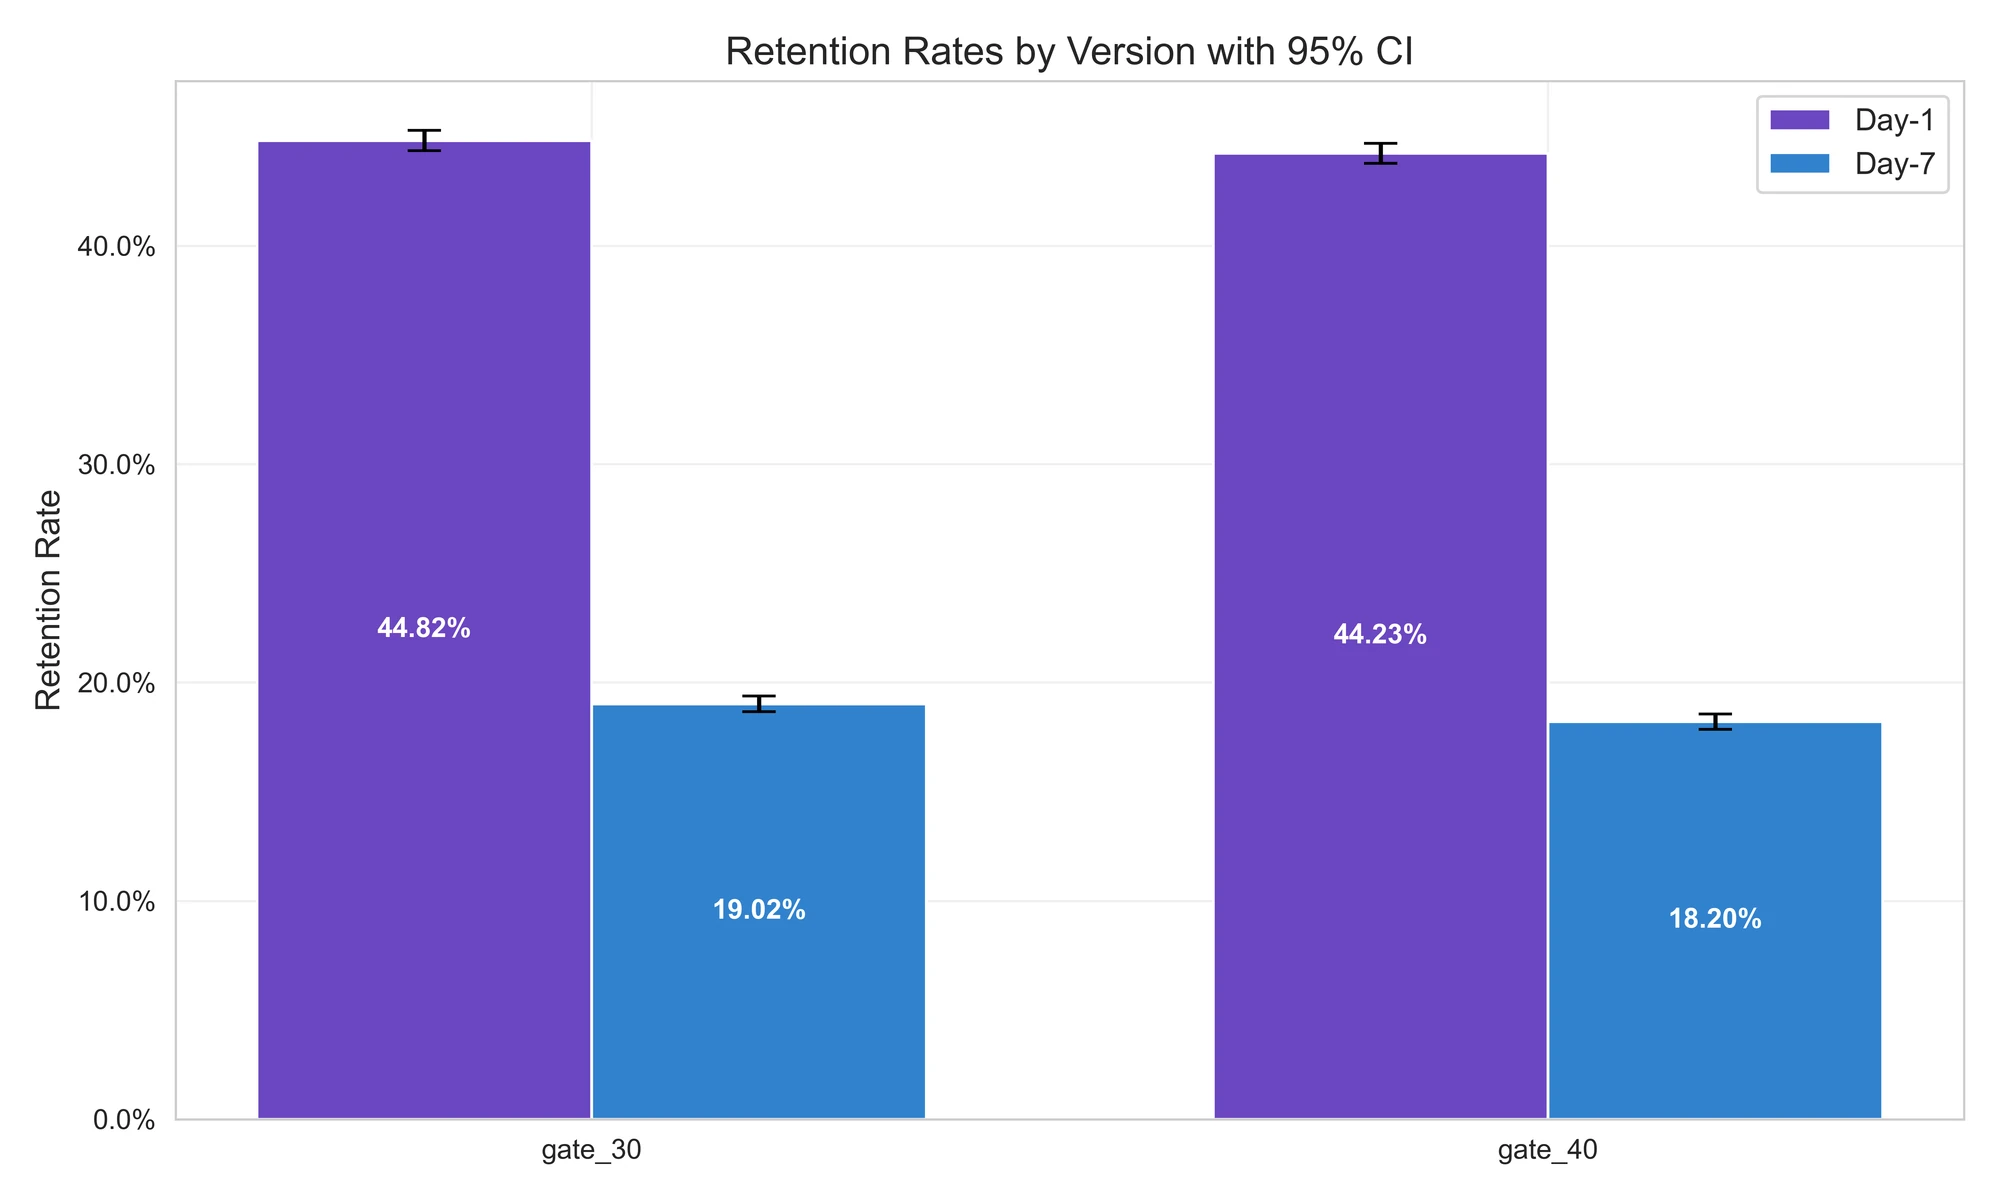
| Day-7 retention | Two-proportion z | 19.02% | 18.20% | -0.82 pp (-4.31%) | 0.0016 |
| Day-1 retention | Two-proportion z | 44.81% | 44.22% | -0.59 pp | 0.15 |
| Game rounds | Mann–Whitney U | 52.46 | 51.30 | -1.16 | 0.15 |
| Welch's t (log) | 2.888 | 2.870 | - | 0.15 |
Note:
- Guardrail p-values are Holm-adjusted.
- Cohen’s h = 0.02 for the primary metric, which is negligible in standardized magnitude (below the conventional threshold of 0.20 for a small effect).
Interpretation:
The difference in primary metric (retention_7) is statistically significant (p = 0.0016). The treatment group (gate_40) shows a −0.82 pp decrease in day-7 retention compared to control (gate_30) with 95% CI [-1.33, -0.31] pp, corresponding to a -4.3% relative drop.
While the result is statistically significant, the effect is negative and below the practical threshold of 1.0 pp. Cohen's h = 0.02 indicates that the magnitude of this effect is negligible. Even though this negative effect is minimal, rollout is not recommended.
Business Impact
Per 100k installs, the test result indicates 820 fewer players retained by day 7, with the true impact likely between 312 and 1328 fewer players (95% confidence). Assuming an ARPU of $0.50 a month, that means ~$410 monthly revenue loss per 100k installs.
Limitations & Next Steps
- Include covariates (region, platform, spend) for adjusted models.
- Timestamps to perform time-to-event analysis.
- Track exposure (whether a player actually reached the gate) for diagnostic analysis.
Repository Structure
notebook/cookie_cats.ipynb: main notebook containing EDA, sanity checks, tests, visualizationsrc/cookiecats/: data loading, plotting, analysis, results table scriptsreports/results_table.csv: experiment results table as CSVreports/report.pdf: experiment report as PDFreports/figures/: plots folder (PNG images) and appendix
How to Run
Clone the repository:
git clone https://github.com/dorukalkan/cookie-cats-ab-test.gitCreate a new data directory at the repo root. Download the dataset from Kaggle into data/.
Then run:
pip install -r requirements.txt
jupyter notebook cookie_cats.ipynb